Tuesday, September 18, 2012

Anti-blur

One of the odd bits in graphics are some of the functions being consistently lossy. One might well think that blur and sharpen are polar opposites of each other, that one could somehow apply a blur and then unblur it. But, that's not really true. The way the functions work is by applying a specific convolution to every pixel. For example a box blur is: .1, .1, .1 .1, .1, .1 .1, .1, .1 It has 9 parts and each of those parts is divided up and dispersed to the adjacent pixels. So it averages the color there with all the colors of the colors next to it to arrive at the new color for the pixel. The sharpen function: -0.1, -0.1f, -0.1, -0.1, 1.8, -0.1, -0.1, -0.1, -0.1 Which is to say the center pixel is made 80% brighter and all the adjacent pixels lose ten percent of that pixel's color. The functions do not need to add up to 1, but if they don't the image either gets brighter or darker overall. This is sort of the inverse of the former except that because of spreading it can well lose detail as the color migrates around.


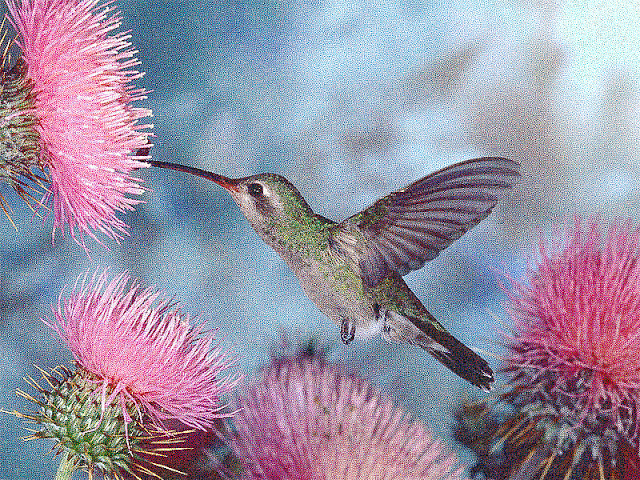
 Using this original image.


Let's see a couple things.   Sharpened.

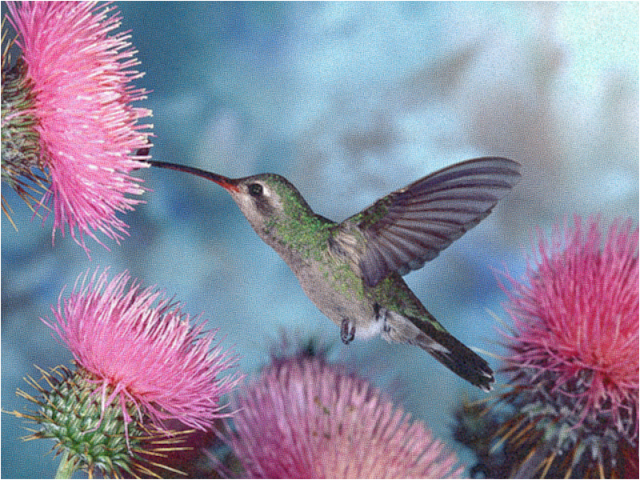
Sharpened and Blurred

 Anti-Blurred
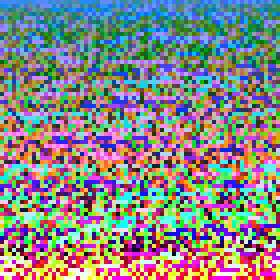
As a fun quirk, I tried to solve the image for blurring. Finding an image which would best look like the original image after being blurred. Which is, I believe, going to be an np problem. As one path precludes other paths, and your likely going to run through the problem with some approximation. In fact, it might be possible to apply such an algorithm to a color quantized image sans blurring with implied blur and render images which are data sparse and solvable to something approximating the original image. Like a blur-implied gif image. The anti-blurred image approximation (finding the optimal might well be np-impossible, or rather knowing that it's the optimal when you have it).

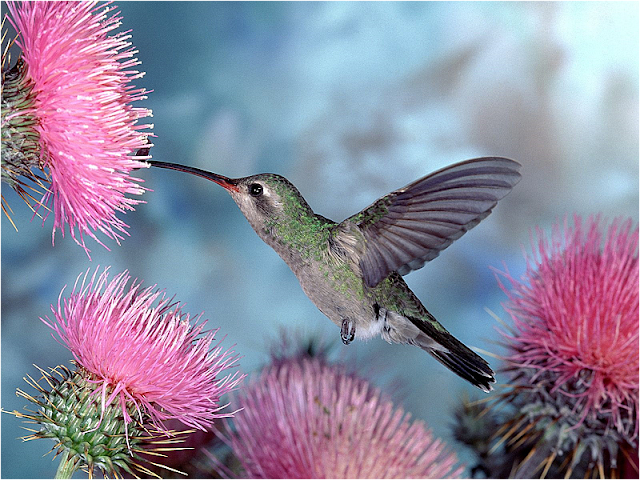
Anti-Blurred Image Blurred

 When we apply a box blur to the image we get the above.

There may be some merit to the idea, but it might need some better encoding methods. As is this takes the same amount of data to display the blur-implied image than the original image. But, it may well have some methods therein to allow for pretty effective color mixing from a reduced subset of colors.

Thursday, September 13, 2012

Thomas Babington Macaulay (Quotes)

To every man upon this earth
Death cometh soon or late.
And how can man die better
Than facing fearful odds,
For the ashes of his fathers,
And the temples of his gods?
Horatius, st. 27.

Thursday, September 6, 2012

Color Distribution Methodology

Getting independent colors which are maximally dissimilar from all previous colors is a fairly common problem. The standard suggested algorithm is to subdivide the most significant differences in colors and then pattern them. I thought this was the case too. So much so that I solved the problem because I thought it would be very useful (and it might). Generally this required two minor breakthroughs understanding how to encode maximally significant differences in colors through binary (flip the ends), which I went through a lot of struggle to get to including my anti-gray codes and derivation algorithm and proof (intersperced gray codes with an additional zero anywhere in it and flipped will maximize hamming distance). And secondly understanding the patterning such that I could derive any value without iteration of the previous values.

Well, looking at the results, it quickly seems that they aren't that great.


Largely there are issues with greens being pretty close even when their RGB values are far, and the patterns constantly making what turn out to be slight variations of your standard pure colors RGB and CYM. You start clashing rather quickly.


The better solution is computationally much more difficult. And generally sort of cheating. You do the hard work. You run through every color you can represent in RGB (16,77,216 of them) and run a heavy duty color distance routine, likely CIE-Lab 2000, then you go in there and manually choose the colors. And then use this as a master list and just read from the list. The standard solution starts picking some greens that look pretty much like the previous greens after like 20. And you should be able to get like 50 colors or so which are visually distinct from one another. Perhaps with pruning of the list by hand.

Using 20k guesses (rather than brute forcing 16-million) I produced this after an hour or so.


There's likely not much left to gain brute forcing the algorithm, but I did (for a smaller value 64) and came out with this.


Which manages to out perform the heck out of the dividing algorithm and could just be read by a standard list. There might be some enhancements to be achieved by converting away from finding maximally good results initially which may cost the overall result to become pareto optimal. Or employ something like k-mean clustering in LabDE2000 colorspace (not really defined as a colorspace but pretty much is exactly that) to better maximize the list. Or goodness forbid collect data by humans voting (it's how the color spaces came about, that and math to approximate that data). Although, this would need to be done in somewhat controlled systems because human eyes are excessively sensitive to conditions. Some colors look similar on a black background when they wouldn't on a white background. Which could maybe be randomized to average out or find colors that do this less than others. It wouldn't be too hard to define a list or two which specifically address this question, because programmatically the question of which colors seem very distinct from a set of previously distinct colors has nothing really to do with computers but humans and how they perceive color, and the ability to approximate this has everything to do with humans and not that much to do with programming.

Observations which have been noted before.
http://www.edwardtufte.com/bboard/q-and-a-fetch-msg?msg_id=0001JS

There are some good color dictionaries out there. But, I'm not convinced there are much more optimal solutions. And it turns out the algorithms needed are much better at making color dictionaries than they would be generating colors on the fly. And since we're dealing with 64 colors max, we're much better doing that.

Tuesday, September 4, 2012

Color Space Comparisons.

So which color space is best.

Using a list of 9413  0 <= R,G,B <= 255, Step 15 colors (17³). And the orange from the Blogger icon. I sorted a bunch of 4x4 boxes for a large variety of color spaces. The diagrams are read left to right top to bottom. The first color is the index color. And the point is to have the colors very similar to that color closer to it. And try to avoid having any colors close to that color further away or very dissimilar colors further. This is a bit hard to figure out but you can generally eyeball it. The top should be the matching colors. You shouldn't have very similar colors to that strewn about the diagram.

The boxes are 70x70 which is 1400,  - 1 for the index color. This means 14 of the most different colors will not be shown.

Addative color. Don't think Euclidean is the simplest distance. I literally took the value distances of the R, G, B, added them up and called that a distance.


Euclidean Distance RGB
Sqrt(R² + G³ +  B²)


Redmean

            long rmean = ( (long)r1 + (long)r2 ) / 2;
            long r = (long)r1 - (long)r2;
            long g = (long)g1 - (long)g2;
            long b = (long)b1 - (long)b2;
            return Math.sqrt((((512+rmean)*r*r)>>8) + 4*g*g + (((767-rmean)*b*b)>>8));

Given at:
http://www.compuphase.com/cmetric.htm


Which is actually a pretty great article.


Luv, Standard Euclidean
The Redmean page says it gives pretty close to Luv colorspace with much less programming power needed. So here's Luv. Luminescence u, v.

Lab, Delta E (standard Euclidean distance)
sqrt(L² + a² + b²)


Lab, Delta 94
Same Lab color space, but rather than a standard Euclidean Color distance the good folks at CIE in 1994 decided to go ahead and tweak it a bit.


Lab, Delta E 2000, CIEDE2000

Using the reworked tweaked distance formula from 2000. I actually like quite a lot. It's my personal favorite and seems to give very consistent results. And consistently good results.


Lab Delta CMC
Intended for threads, paints, dyes, etc. It's the standard for that industry. Apparently you're much better off with a color to dye something than no color. Which is maybe why everything with no color is basically at the bottom, maximally far away from colors with saturation.


Hunter Lab, it uses the XYZ color space (which LAB also uses) and uses a different way to get the L,a,b values. Which are luminescence and some complementary colors.


HSL. You can't just plop this into a Euclidean distance formula you need to make a shape and get the distance within that shape. Anything with a hue, must have this done. Because H=360° and H=0° are not polar opposites, they are the same color. They should be in the same place not 360² away from each other.

In this case, I have some old code and it's wrapped up in a two stuck together half cone. Which is to say that it's a cone where the L value ends half way at the cone, and has maximal colors at L = 0.5.


HSB/HSV

Using value rather than lightness Placed into a cone.

        double X = S*V*Math.cos(H);
        double Y = S*V*Math.sin(H);
        double Z = V;


Directly invokes the HSB routine from Java's Color.RGBtoHSV() routine.


HCL: M. Sarifuddin and Rokia Missaoui
I just wrote a very long article dissing this color space. Mostly because it's ill defined and claims to be better than it is through methodological flaws. And I dunno what else.


Weighted Euclidean: 22,43,35
About this time last year, I wrote a blog post where I ran all the numbers for Delta E, Lab. And averaged the distances based on the specific colors and came up with these weights. Also noting the Compuphase paper got similar results. There are standard given weights but these are actually for Gamma. They are the weights as to how much that color contributes to how bright the color looks. 30,59,11 are correct weights here, blue contributes very little to how bright a color seems. In fact, anti-blue (yellow) is wildly bright like bizarrely so. You can't even read yellow text on a white background.


Weighted Euclidean: 30,59,11
We're dealing with Orange (specifically Blogger Icon Orange). So the huge over emphasis on red is going to make it cluster like this but, let's check out a couple other colors with similar weights.


Weighted Euclidean: 22,43,35


Weighted Euclidean: 30,59,11


Weighted Euclidean: 22,43,35


Weighted Euclidean: 30,59,11
The weighting here is very anti-blue. As a result bluish colors  get tossed all over the place.

The blue here is Google Icon blue (66,133,244).


 Lab Delta 2000, Green
For Reference.
Lab Delta 2000, Google Blue
For Reference


Hopefully we should have a better idea about color spaces and which ones may or may not be good or bad. And a pretty firm grasp on the weighted Euclidean weights for color distance being wrong. Those are fine weight when we're looking for gamma, but how bright we see colors is different than how discriminating we are between colors. You are much better with 2,4,3 than that 30,59,11 crap. Or a much better color distance formula.
HCL: a new Color Space for a pack of lies.


HCL: a new Color Space for a more Effective
Content-based Image Retrieval
M. Sarifuddin and Rokia Missaoui
RESEARCH REPORT
D´epartement d’informatique et d’ing´enierie, Universit´e du Qu´ebec en Outaouais,
C.P. 1250, Succ. B, Gatineau (Qc), Canada, J8X 3X7.

I conduct an analysis of many dominant color spaces. Including the pack of lies called HCL. I've use colorspaces rather frequently and have implementations of all the major ones. Due to the modular nature of they are rather easy to collect. So seeing a reference to HCL (by M. Sarifuddin and Rokia Missaoui), I decided to give it a try. I managed to find a good implementation in PERL (Copyright (C) 2007, Mattia Barbon) and port it over to java to give it a try. After all the pretty pictures in the paper made it seem really effective.


Look how obvious (i) is better than something silly like DeltaE LAB. That's so superior! But, wait, some of those figures don't make sense. DeltaE is the change in the Euclidean distance. Sure, you can toss it at the tristimulus values in RGB, and LAB but LCH clearly has H. Hue. You can't apply it there. And Delta E94, is a modification of LAB colors. Why are you applying to things which aren't lab? And a cylindric distance on HSV? That's typically viewed as a cone but I suppose a cylinder would work too. But, moreover, why does I get to have so much more yellow? I mean, am I to suppose that Delta E, LAB just thinks those greens are much closer? Or is there a major flaw in methodology here?

So checking the methodology we find that it randomly chooses crimped RGB colors 0 <= R,G,B <=255, step 15. So there's 17 different steps in any of the particular RGB values. And 4913 (17³) different colors available. So loading up my trusty Photoshop eye dropper (on auspices of finding the same first index color of yellow for a test) I came across an oddity. These values are not mod-15. It can't really have used this methodology, that or some color rounding issue caused it to fail or the conversion of the colors into a .pdf did some color quantization, in a paper about color.

Checking figure 3i, here we find that this theory cannot be justified at all. The color yellow is 253,254,31. The next three boxes are only changed by their blue component 34,39,45. These colors are not permitted by the methodology. SHENANIGANS! Not only do you have a heck of a lot of yellow, you have yellows you're not even *allowed* to have.

Also, why are these "randomly" varying? "Each one of them is compared to a collection of randomly generated colors using each one of the proposed similarity measures." -- No. That's not fair. Then if your distance criteria is unforgiving you simply win. If the color is within 3 values between RGB, go ahead and give that a distance of 1. For *everything else* return a infinity. Well then it just keeps randomly getting new colors until it finds things that my threshold function allows? Namely pretty much identical colors?

Let's try this again, with something proper. 48 squares. Index color and first 47 colors sorted from this 4913. No random. No threshold. The closest colors without repeats given that specific criteria.

 Lab Delta 2000.


 Lab Delta 1994


Lab Delta Euclidean


Hunter Lab


Luv


RGB Delta Euclidean


Redmean


And Finally....


Drumroll please


HCL!


Oh, did I mention the hue formula is wrong?

        if (rg >= 0 && gb >= 0) {
            H = 2 * H / 3;
        } else if (rg >= 0 && gb < 0) {
            H = 4 * H / 3;
        } else if (rg < 0 && gb >= 0) {
            H = 180 + 4 * H / 3;
        } else if (rg < 0 && gb < 0) {
            H = 2 * H / 3 - 180;
        }
It treats rg (R - G) and gb (G - B) as complimentary colors. These aren't complementary but tristimulus. It corrects this by tweaking the ranges of the hue. What was 90 and 90 becomes 60 and 120. Nudging the hue into where it would be if there were complementary colors.

Since it uses Arctan(rg/gb) to make the hue ranging from -90° to +90° it needs to shift two of the sections over. And the paper wrongly chooses the -+, and --. When really it should use +-, --. Shifting over quadrant II and IV rather than III, IV. The angle 0 is +Y, not +X. The range being utilized are quadrant I, and quadrant III. The +Y bits. When the Y (in this case gb) is negative it needs to be rotated by 180. It does this for +X sections. Leaving nothing in quadrant I, and two overlapping color areas in quadrant III.


+180 and -180 are the same thing. It doesn't matter which way you turn when you turn around. You end up around. So really it should be:

if (gb > 0) H += 180;

rather than,

if (rg > 0) H += 180;

Though in the equations this is done to preserve the sign.


You properly need to invert the hue. And roll it over to to the other side.


This turns out to be a lot of work for something that isn't really that great. The colors are read left to right, top to bottom. And it *should* have the closest colors to the index color. So the fact that there's a color in the 3 row that looks a lot like the index color and certainly more than the browns and greens in there. Means that it gets marked off. Compare this to something rather nice like LAB DeltaE2000:


While there are some colors that seem a bit closer (though the viewing area can make a significant amount of difference with background colors etc) it really does seem to keep the best colors right up top.

But, the paper also includes it's own distance formula. Rather than using cylindrical distance, we can use DistanceHCL. Which gives us:


 Is this an improvement? Yes. Is this an improvement over CIEDE2000 (Lab DeltaE2000), no. Not remotely.

One of the things that should be noted is that there's a big difference between color distance routines which are simply different foldings of RGB space, and things like LAB which actually pushes and pulls various hue ranges with regard to human eyes. It makes a big difference apparently because regardless how well you can tweak the space into a different shape, if there's no regard to the color of that shape at a some specific area you will always be hampered by the non-linear nature of RGB. We see greens more clearly than blues, and blues better than reds (although blue makes less of a contribution to our perception of gamma).

Sunday, September 2, 2012

Color Distribution Code.

So final draft:
    public Color getColor(int i) {
        return new Color(getRGB(i));
    }

    public int getRGB(int index) {
        int[] p = getPattern(index);
        return getElement(p[0]) << 16 | getElement(p[1]) << 8 | getElement(p[2]);
    }

    public int getElement(int index) {
        int value = index - 1;
        int v = 0;
        for (int i = 0; i < 8; i++) {
            v = v | (value & 1);
            v <<= 1;
            value >>= 1;
        }
        v >>= 1;
        return v & 0xFF;
    }

    public int[] getPattern(int index) {
        int n = (int)Math.cbrt(index);
        index -= (n*n*n);
        int[] p = new int[3];
        Arrays.fill(p,n);
        if (index == 0) {
            return p;
        }
        index--;
        int v = index % 3;
        index = index / 3;
        if (index < n) {
            p[v] = index % n;
            return p;
        }
        index -= n;
        p[v      ] = index / n;
        p[++v % 3] = index % n;
        return p;
    }

The first 729 (9^3) colors displayed in a 27x27 cube.


Color Distribution sans recursion.

I did a bit of math and got rid of the recursive section.

    public int[] getPattern(int index) {
        int n = (int)Math.cbrt(index);
        index -= (n*n*n);
        int[] p = new int[3];
        Arrays.fill(p,n);
        if (index == 0) {
            return p;
        }
        index--;
        int v = index % 3;
        index = index / 3;
        if (index < n) {
            p[v] = index % n;
            return p;
        }
        index -= n;
        p[v      ] = index / n;
        p[++v % 3] = index % n;
        return p;
    }
Turns out you can calculate N without iterating the whole thing, but by rather taking the cube root or the index. Which makes sense if you consider all the previous patterns with characters from 0-(N-1)  would take N*N*N space to use up and we by definition used that up.